@TonyNames post kicks off this article off with a simple but sharp point: if you really want a 100% sell‑through rate, you can just price every domain at 1 dollar.
You’ll “sell out” your portfolio, hit that magical 100% STR, and lose money.
It’s like giving away $10 bills for the low, low cost of $1.
The STR metric looks heroic. Your bank account suffers.
That’s the gut punch of his post: chasing STR as a vanity number can push you toward terrible pricing decisions.
The higher the STR, the more people clap for you.
But if you got there by underpricing your domain names, then you’ll quickly learn that applause doesn’t pay the bills.
Let’s unpack why.
What STR Actually Measures (And Why It’s Misleading Alone)
Sell Through Rate (STR) is straightforward: it’s the percentage of domains you sell in a given time period, usually a year.
So if you hold 500 domains on average over a year and you sell 10 of them, your STR is:
- 10 ÷ 500 = 0.02
- 0.02 × 100 = 2%
That’s it. Nothing fancy.
In domain investing, STR is usually low. Most experienced investors land around 1–3% on average portfolios, with stronger, well‑priced portfolios sometimes pushing 4–5%.
Anything above 10% is rare and usually comes from aggressively low prices, highly liquid trade-type names, or actively outbounding domains for sale.
So yes, at first glance, 5% “looks” better than 2%.
Higher STR implies faster turnover, fewer long‑term holds, and more action.
That’s why people get hung up on STR: it feels like a clear, simple “higher is better” number.
But here’s the trap: STR doesn’t tell you what you sold those domains for.
A 5% STR at $300 average prices is a completely different business from a 1% STR at $10,000.
One might be busy. The other might be wealthy.
The Real Metric to Focus On: Revenue Per Domain (RPD)
Tony’s underlying argument is that what actually matters is not STR alone, but how much money each domain is generating for you on average.
He suggested multiplying the STR by the Average Selling Price (ASP).
Pros in the industry call this metric Revenue Per Domain (RPD).
And it’s the metric you should be focusing on.
Revenue Per Domain (RPD)
If you want Revenue Per Domain, you take annual gross revenue and divide by the number of domains (N):
And as the formula above indicates, RPD is the Annual Gross Revenue ÷ N, which is the same as the STR x ASP.
Why pros love RPD:
- It lets you compare portfolios of completely different sizes.
- It focuses directly on money per domain, not raw sales volume.
- It can be used across different revenue generation models, like sales, parking, zero click, and lead generation.
- It filters out the noise of “who has the biggest portfolio” and keeps the conversation about efficiency.
And it’s elegant for privacy too.
Why RPD Is Shareable Without Exposing Your Business
Here’s a simple example.
- New investor: 100 domains, $5,000 annual revenue.
- RPD = $5,000 ÷ 100 = $50 per domain.
- Veteran investor: 10,000 domains, $500,000 annual revenue.
- RPD = $500,000 ÷ 10,000 = $50 per domain.
Different scale. Same efficiency.
Those two investors can talk shop like this:
“Hey, my RPD is around $50 this year. Where are you sitting?”
Nobody had to say, “I made half a million dollars” or “I only made five grand.” They just compare how well each domain is working for them on average, and can dive into specific tactics that helped drive the RPD.
Total revenue, on the other hand, is way more personal — and honestly, often too revealing for public forums or social media.
So you get a metric that is:
- Normalized
- Comparable
- Safe to share
That’s exactly why it’s the metric many serious investors default to when they talk performance.
Tony’s $1 Example: The STR Illusion
Now back to the punchline of Tony’s 𝕏 post: if you price everything at $1, you might hit a near‑perfect STR.
Imagine a 1,000‑domain portfolio, all at $1 Buy‑It‑Now. You could theoretically sell all 1,000 names over a year:
- STR: ~100%
- ASP: $1
- Annual revenue: 1,000 × $1 = $1,000
But cost to purchase? Let’s say they’re $12 per domain on average:
- Purchase cost: 1,000 × $12 = $12,000
- Net result: you lose about $11,000
On paper, your STR is gorgeous. In reality, your business is burning cash. That’s the core of his critique: an isolated metric like STR can flatter you while your portfolio quietly bleeds.
RPD makes that failure obvious:
- Revenue Per Domain = $1,000 ÷ 1,000 = $1 per domain
- Purchase cost per domain is ~$12
- You’re losing money on each domain, even though you “sold everything”
So what looks like “peak performance” under the STR lens is actually “worst possible outcome” under RPD.
Side‑by‑Side Strategies Using RPD
Let’s stay with the same hypothetical 1,000‑domain portfolio. Assume renewal cost is about $12,000 per year in total. Ignore commissions for simplicity.
Here’s how different strategies stack up when you look at Revenue Per Domain (RPD) explicitly:
| STR | ASP | Domains Sold/Year | Annual Revenue | RPD | Net Profit |
|---|---|---|---|---|---|
| Volume‑focused (low prices) High turnover, lots of sales; efficiency per name is decent but not maxed. |
|||||
| 5% | $1,500 | 50 | $75,000 | $75 | ~$63,000 |
| Balanced (mid prices) Very healthy middle ground; many full‑timers aim roughly for $50–100 RPD. |
|||||
| 2% | $4,000 | 20 | $80,000 | $80 | ~$68,000 |
| Value‑focused (high prices) Fewer sales, bigger checks; high per‑domain return, fits premium portfolios. |
|||||
| 1% | $10,000 | 10 | $100,000 | $100 | ~$88,000 |
| Extreme low‑price chase STR looks amazing but RPD and net profit start to sag; lots of work for less. |
|||||
| 10% | $500 | 100 | $50,000 | $50 | ~$38,000 |
| Tony’s “$1 example” Max STR, almost zero RPD; textbook case of why STR is not the goal. |
|||||
| ~100% | $1 | ~1,000 | $1,000 | $1 | -$11,000 |
| STR | ASP | Domains Sold/Year | Annual Revenue | RPD | Net Profit |
A couple of key things pop out:
- The value‑focused strategy, with the lowest STR, actually has the highest RPD.
- The extreme low‑price play, with a flashy 10% STR, has weaker RPD and much lower profit.
- Tony’s $1 example turns STR into a joke: max STR, min revenue.
So when someone says, “I hit 5% STR this year,” your follow‑up should honestly be, “Nice. What’s your RPD?”
What a “Good” RPD Looks Like
Based on industry conversations, marketplace data, and portfolio reports, you see some broad ranges:
- Many portfolios cluster in the $20–60 per domain per year range.
- Smaller, stronger, and more curated portfolios (especially in hot extensions like .io, .ai, or standout .xyz holdings) can push into the $100–300+ per domain per year band when managed well.
Again, STR isn’t useless. It helps you understand how often your inventory moves. But without RPD, it’s like judging a business only by “number of units sold” and ignoring what each unit sells for.
STR vs. Price: Finding the Sweet Spot
One subtle point Tony is really hinting at is the trade‑off between price and STR.
Roughly:
- Lower prices → Higher STR, lower ASP
- Higher prices → Lower STR, higher ASP
Your goal isn’t to maximize STR; it’s to maximize RPD, which is the STR × ASP.
That means:
- Pricing too low: STR might spike, but RPD can stay mediocre, especially once renewals and commissions are factored in.
- Pricing too high: STR might collapse and RPD can drop if you barely sell anything.
- Pricing in a smart middle: even if STR is modest, ASP can be strong enough that RPD climbs.
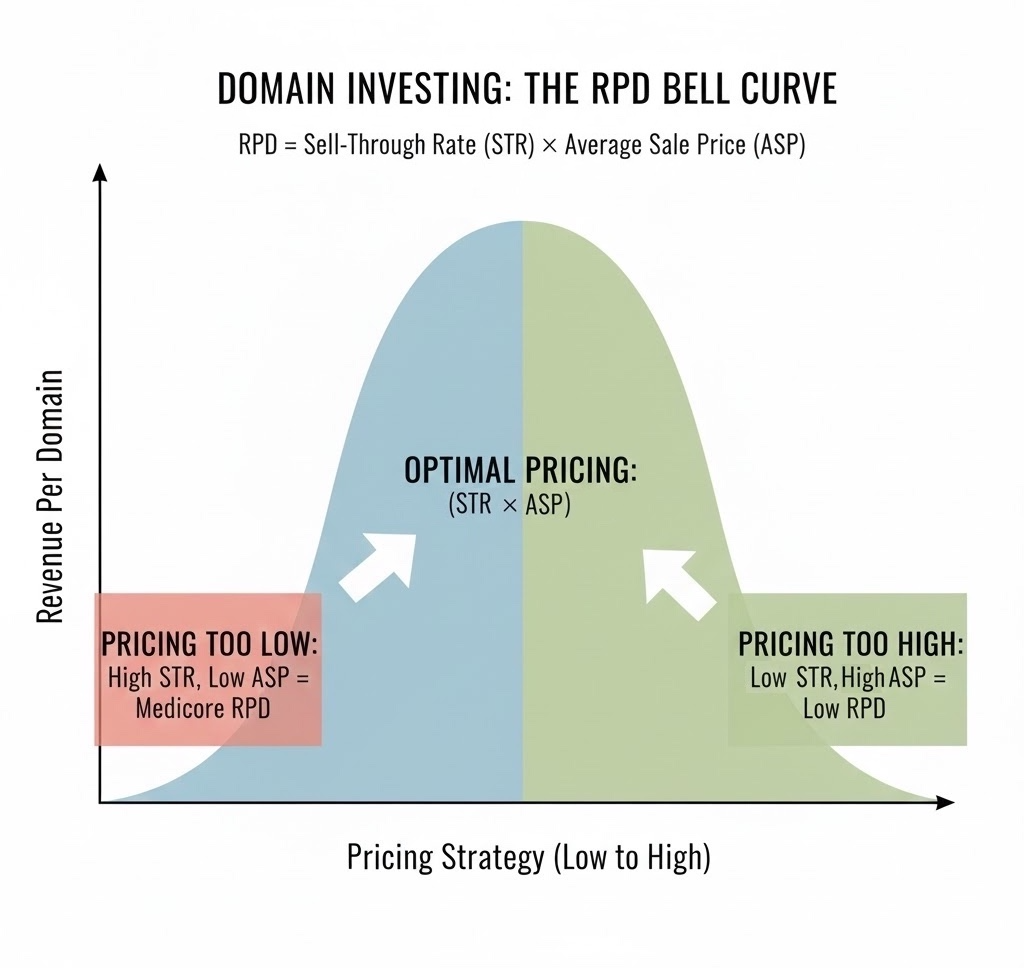
In other words, the “optimal” price is the one where RPD peaks, not where STR peaks.
You won’t always know that exact number, especially with small portfolios where sales are sparse and data is noisy. But conceptually, that’s the target: tweak pricing to push your RPD up over time, not just your STR.
Why RPD Is the Metric Pros Actually Care About
Putting it all together:
- STR tells you how often your names sell.
- ASP tells you how much you get when they do.
- RPD tells you how much money each domain earns you, on average, per year.
That last one is the metric that lines up with reality: renewal bills, opportunity cost, and long‑term ROI.
Tony’s 1‑dollar thought experiment is a perfect illustration of why STR is a dangerous solo metric. Yes, you can max it out — if you’re willing to destroy your profitability in the process. RPD, by contrast, rewards strategies that balance selectivity, pricing, patience, and quality.
RPD’s Key Limitation: Acquisition Costs
RPD measures gross revenue per domain, making it ideal for normalized comparisons like evaluating investor to investor or TLD performance across a portfolio.
However, it has one significant blind spot: it completely ignores acquisition costs, which is often the largest expense in domain investing.
Investors who frequently buy at auctions or privately can achieve a strong RPD yet remain cash-flow negative for years, as sales revenue slowly chips away at the initial outlay.
Low-cost hand registrations (~$12 acquisition), by contrast, turn even average RPD into quicker, more reliable profitability.
RPD is the go-to metric for discussing ongoing sales efficiency publicly.
For assessing your own true portfolio profitability, always calculate net figures separately by subtracting all costs — renewals, commissions, and especially acquisitions — from revenue.
Addendum: Notes on Revenue Per Domain (RPD) Calculations
Gross vs. Net Revenue
RPD, as used in industry discussions, reports, and this article, is always based on gross sales revenue — the full reported sale prices before any deductions.
Deductions may include marketplace commissions (typically 5–30%), payment processing fees, or other expenses. Using gross figures ensures consistent, apples-to-apples comparisons across investors, portfolios, and TLD comparisons.
Lease-to-Own (Installment) Sales
For domains sold on lease-to-own or finance plans, only the revenue actually received during the measurement period (usually the calendar year) is counted toward that year’s RPD.
- Example: A $10,000 lease-to-own deal with $2,000 paid upfront and $1,000/month over 8 months → ~$10,000 total recognized in year 1 (depending on exact timing).
- Future payments are counted in the years they are received.
This matches how most marketplaces report installment sales for performance metrics.
Taxes
Taxes vary wildly by country, entity type (individual, LLC, corporation), and personal situation, so they are never included in shared RPD figures.
RPD remains a pre-tax, pre-commission gross revenue metric.
These conventions keep RPD a reliable, normalized benchmark for portfolio efficiency while leaving net profitability calculations to each investor’s private books.